Giỏ hàng hiện tại chưa có sản phẩm nào!
Simple self-hosted monitoring tools
Recently I need a tool to monitoring my devices, and alert me if some services goes down.
I found some softwares on internet.
- Checkmk – Your complete IT monitoring solution
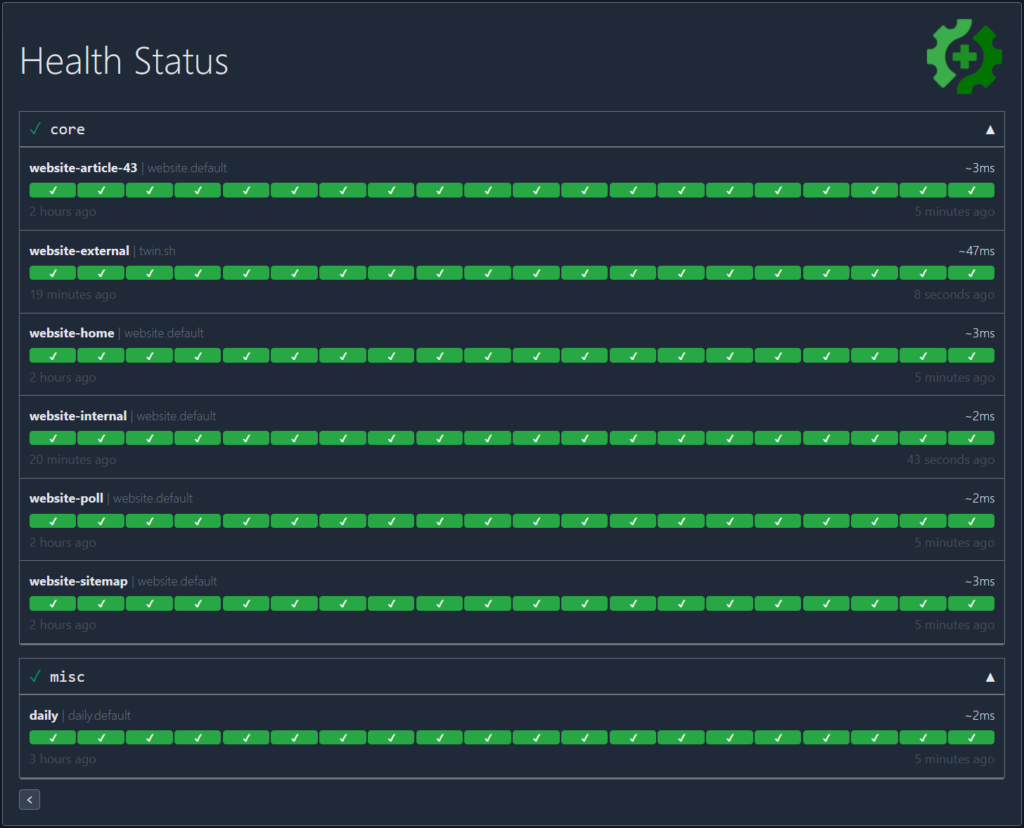
- Gatus – ⛑ Automated developer-oriented status page
- Grafana – The open-source platform for monitoring and observability
- Prometheus – monitoring system and time series database
- huginn – Create agents that monitor and act on your behalf. Your agents are standing by!
- Monit – Up and running in 15 minutes!
- Monitoror – Unified monitoring wallboard — Light, ergonomic and reliable monitoring for anything
- Netdata – The open-source observability platform everyone needs!
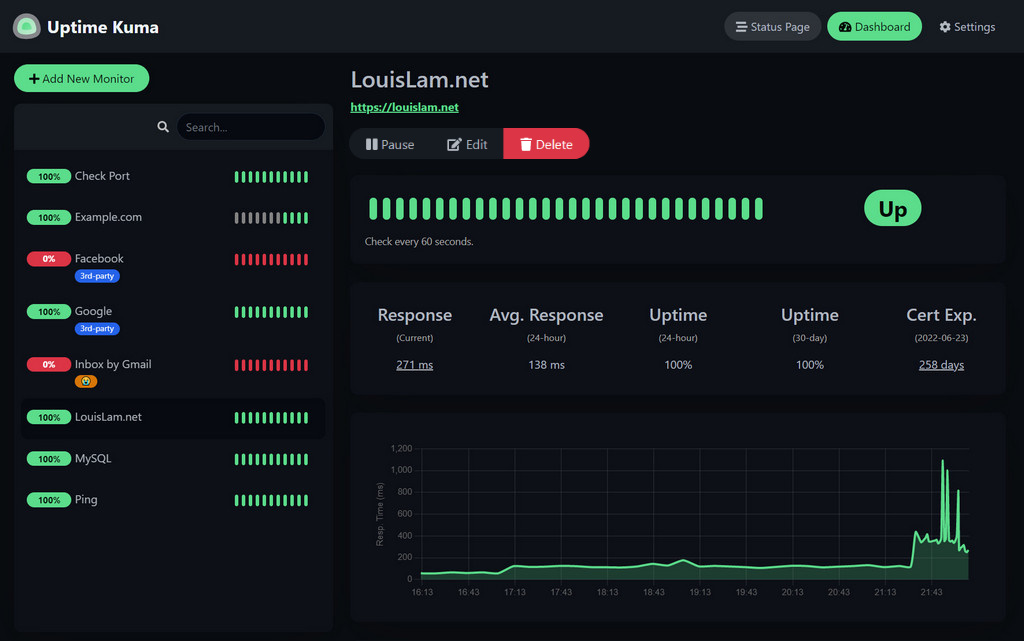
- Uptime Kuma – A fancy self-hosted monitoring tool
- Zabbix – Real-time monitoring of IT components and services, such as networks, servers, VMs, applications and the cloud
I heard Grafana, Prometheus and Zabbix before but they seems too complicated to me.
I have experience with Monit before, the config was simple, it can alert via email. I will have it on my server but I wanted to try something new.
So I tried Netdata, for my needs it was simple with fancy UI but I don’t want all of its feature.
Gatus and Uptime Kuma seems fit my needs, it does the job and it has clean UI.
I will try Gatus in several days and still running Netdata for now.
After all, maybe I will go back with Monit because I don’t really want UI, just monitoring and alert.

Trả lời